2 Organising projects for reproducibility
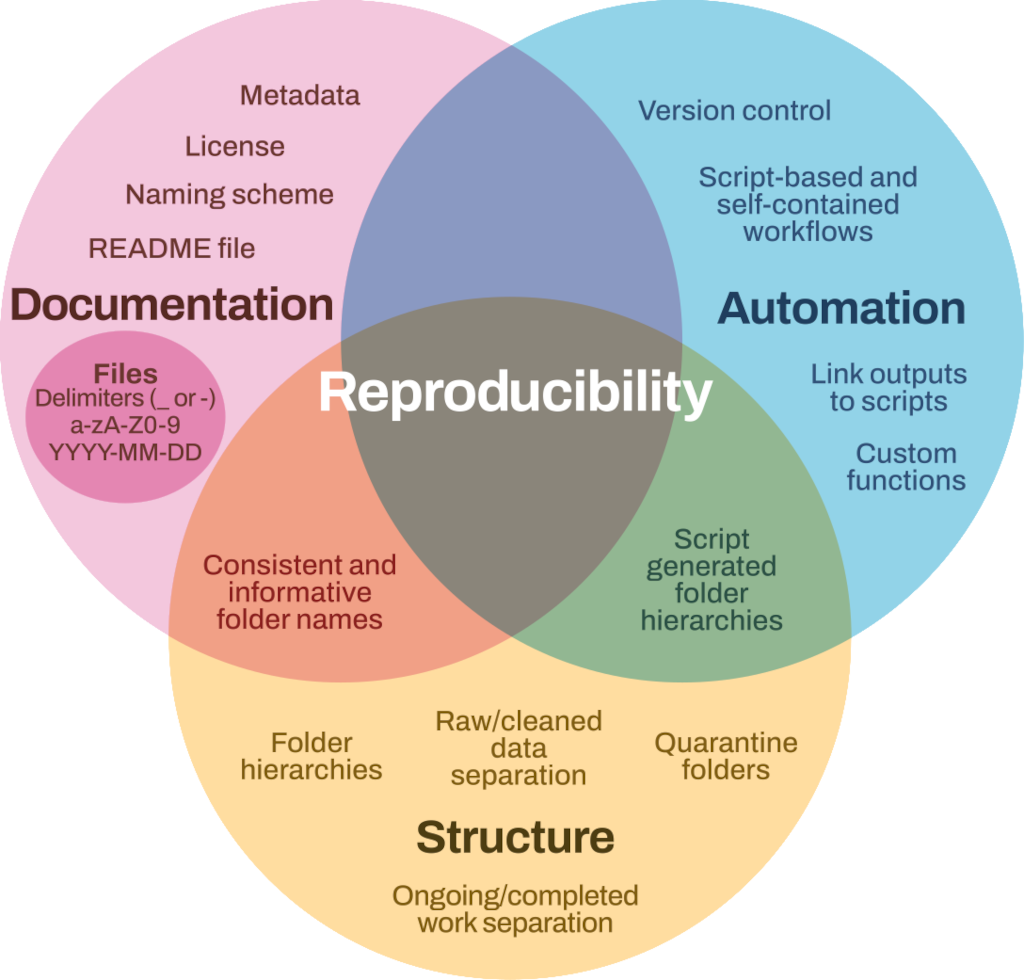
The fundamental idea behind a robust reproducible analysis is a clean repeatable script-based workflow (the sequence of tasks from the start to the end of a project) that links raw data through to clean data and to final analysis outputs. Here, we define raw data as information collected through observations, experiments, or generated by instruments or devices. Raw data refers to materials that cannot be recreated once lost (e.g., worksheets, notes, lab notebooks). Most analyses will be re-run many times before they are finished (and perhaps again throughout the review process) so the smoother and more automated the workflow, the easier, faster and more robust the process of repeating will be. In other words, you should build a reproducibility ecosystem (Figure 2.1). These principles apply to whatever programming language or analytical tools you are using.
2.1 Principles of a good analysis workflow
- Start your analysis from copies of your raw data.
- Clean, merge, transform (etc.) data in scripts (not manually). Raw data can be used as an input for the analyses, but the output should be saved separately and not replace the raw data.
- Split your workflow (scripts) into logical thematic units. For example, you might separate your code into scripts that (i) load, merge and clean data, (ii) analyse data and (iii) produce outputs like figures and tables.
- Eliminate code duplication by packaging useful code into custom functions (see Chapter 3). Add comments for more clarity; explain expected inputs and outputs of formulas, what they do and why.
- Document your code and data as comments in your scripts or by producing separate documentation (see Chapter 3 and Chapter 5).
- Keep any intermediary outputs generated by your workflow separate from raw data.
- Decide on an appropriate repository or platform to publish and/or archive your code prior to the analysis (See Chapter 7).
- Use structured folders (for example R Projects, Workspaces in RStudio or R packages such as workflow R) to keep things organised.
2.2 Organising and documenting workflows
The simplest and most effective way of documenting your workflow—its inputs and outputs—is through good file system organisation and informative, consistent naming of analysis materials. The name and location of files should be as informative as possible on what a file contains, why it exists and how it relates to other files in the project. These principles extend to all files in your project and are intimately linked to good research data management, such as described in the BES Better Science Guide on Data Management1.
Nothing! We can use the words folder and directory interchangeably as they mean the same thing. In this guide we use the word folder when talking about organising files and directory when talking about programming. Note that R and Python always refer to folders as directories. But don’t let this confuse you!
2.3 File system structure
It’s best to keep all files related to a specific project within a single folder. Integrated development environments (IDEs) such as RStudio and VS Code, offer a great way to keep the workflows self-contained and portable. IDEs can use file paths to data sources or scripts and remain valid even when projects are transferred between computers or shared with collaborators (see Chapter 3). An exception can be code associated with numerous projects that may live in its own folder (you could also consider making this into a package; see R Packages (2e) for advice on making packages in R).
There is no single best way to organise a file system. The key is to make sure the structure of folders and location of files is consistent, informative, clearly described and works for you.
Here’s an example of a basic project folder structure:
- The data folder contains all input data (and metadata) used in the analysis. This folder should include the raw data (as original files or in a sub-folder named raw-data). You might also have a cleaned-data folder.
- The manuscript or deliverable folder contains the deliverable (optional).
- The figs folder contains figures generated by the analysis.
- The output folder contains any type of intermediate or output files.
- The analyses folder contains analysis scripts.
- The functions folder contains functions with function definitions.
- The reports folder contains files that document the analysis or report on results (see Chapter 5).
2.3.1 Folder structure
- Be consistent. It is important that once you have decided on a naming scheme for folders, you stick to it. If you can, agree on a naming scheme at the start of your research project. Being consistent may be more important than following a particular naming scheme.
- Structure folders hierarchically. Start with a limited number of folders for the broader topics and create more specific folders within these, as and when they are required.
- Include a
READMEfile to describe the project and provide some basic orientation around project files. Good naming of files should take care of the rest. Remember to describe the naming scheme in the README file (see Chapter 7). - Include an appropriate license (see Chapter 7).
- Quarantine inputs and materials given to you by others (i.e. keep it in a separate folder). Rename and repurpose into your own file system, recording what has been done. Ensure provenance of inputs is tracked.
- Keep track of ideas, discussions and decisions about analysis. An info folder where you store important emails or idea drafts could work. Otherwise, many online version control (see Chapter 6) hosting services (such as GitHub) have issues management features which provide a lot of useful functionality for this purpose.
- Separate ongoing and completed work. Keep older documents separately from current ones.
Positron is a new IDE designed for use with both R and Python. It is made by the company Posit which also distributes RStudio. At the time of writing, Positron is still in beta testing so we don’t refer to it in the guide, but it is possible that many RStudio users will switch to Positron in future. Posit has stressed that maintenance and development of RStudio will continue, but if you regularly use R and Python you might want to check Positron out.
2.4 Informative, consistent naming
The rules of effective naming extend to all files, folders and even objects in your analysis (see Chapter 3). Naming conventions help make the contents and relationships among elements of your analysis understandable, searchable and organised in a logical fashion. For example, informative, consistent naming can allow you to easily find data generated during a specific period, data generated by a particular script, analysis outputs generated using specific values of a parameter and objects generated by a specific function (e.g., see Table 2.1).
| Bad | Better |
|---|---|
01.R |
01_download-data.R |
abc.py |
02_clean_data_functions.py |
fig1.png |
fig1_scatterplot-bodymass-v-brainmass.png |
IUCN metadata.txt |
2016-12-01_IUCN_reptile_shapefile_metadata.txt |
2.5 Key principles of good file naming
Good file names should:
2.5.1 Be machine readable
- Avoid spaces, punctuation, accented characters and case sensitivity. More specifically, stick to “a-z A-Z 0-9” characters.
- Use periods/full stops for file type only (i.e.
.csv). - Use delimiters consistently, i.e.
_to separate metadata to be extracted as strings later on and-instead of spaces or vice versa but don’t mix. This makes names regular expression-friendly (see https://simple.wikipedia.org/wiki/Regular_expression if you don’t know what we mean by this), i.e. easy to match and search programmatically and easy to analyse. Note that Python cannot use-so you need to use_for file names.
2.5.2 Be human readable
- Ensure file names include informative descriptions of their contents.
- Adapt the concept of the slug to link outputs with the scripts in which they are generated. A slug in this context is something short that you could stick on to any file name to make it clear what analysis/paper/report it refers to, e.g.
bird-beaks\analysis.Rorbird-beaks\results.csv, where bird-beaks is the slug.
2.5.3 Work well with default ordering
Starting file names with a number helps.
For data, this might be a date allowing chronological ordering.
Make sure to use YYYY-MM-DD date format (year-month-date, which follows the ISO 8601 standard2; to avoid confusion between differing local dating conventions and to ensure files are sorted chronologically.
For scripts, you could use a number indicating the position of the scripts in the analysis sequence e.g.
01_download-data.RMake sure you left pad single digit numbers with a zero or you’ll end up with this:
10_final-fig-for-publication.png
1_figure1.png
2_figure2.png
Data Management Guide, (2018), Better Science Guides, British Ecological Society.↩︎
https://en.wikipedia.org/wiki/ISO_8601 accessed 15th August 2025↩︎